Location: Universidad Politécnica de Madrid (UPM) > Grupo de Tratamiento de Imágenes (GTI) > Data > Automatic soccer field of play registration
Description:
This site contains some supplementary material associated to the detection strategy proposed in [*].
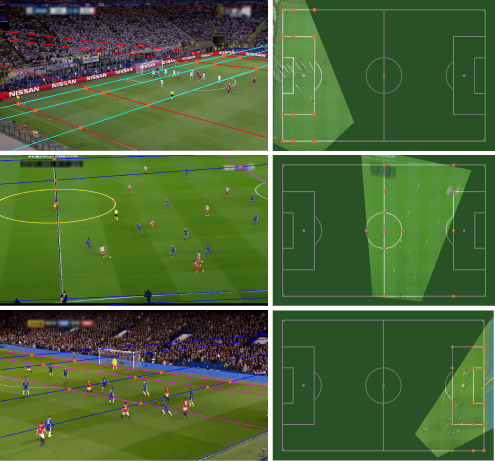
The work [*] proposes a strategy for automatically registering the images of soccer matches on a model of the field of play. First, to discard the areas of the image that do not belong to the field of play, an efficient and robust segmentation method based on the analysis of the green chromaticity is applied. Then, the straight line marks in the image are detected very accurately thanks to a segment detection method that discard noisy edges. Finally, the lines are classified into six possible groups by means of a probability decision tree. Additionally, for providing results in images showing the central circle of the field of play, not only the straight lines but the line corresponding to the central circle is modeled. To determine when a registering result is valid or not, a three step validation stage has been also developed.
For any question about the article [*] or about the described test data, please contact Carlos Cuevas at ccr@gti.ssr.upm.es or Carlos Cuevas at ccr@gti.ssr.upm.es.
Citation:
[*] C. Cuevas, D. Quilón, and N. García, "Automatic soccer field of play registration", Pattern Recognition, vol. 103, article 107278, pp. 1-14, Jul. 2020 (doi: 10.1016/j.patcog.2020.107278).
Material:
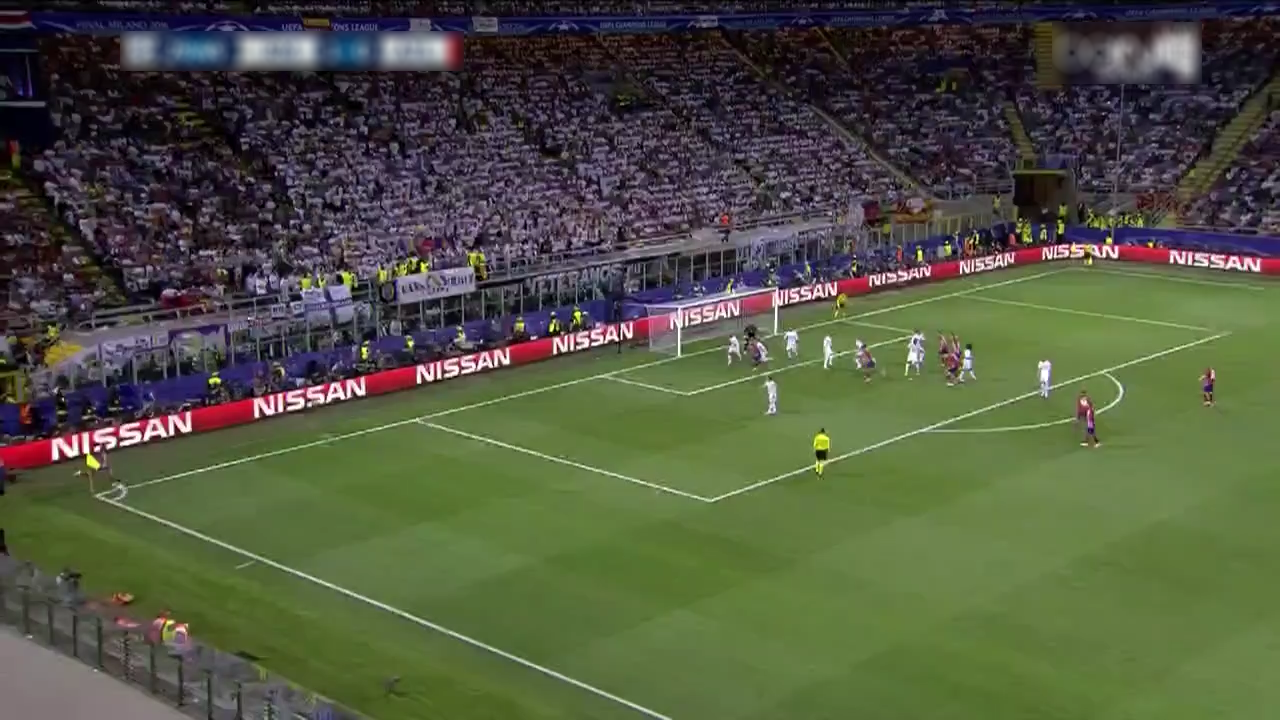
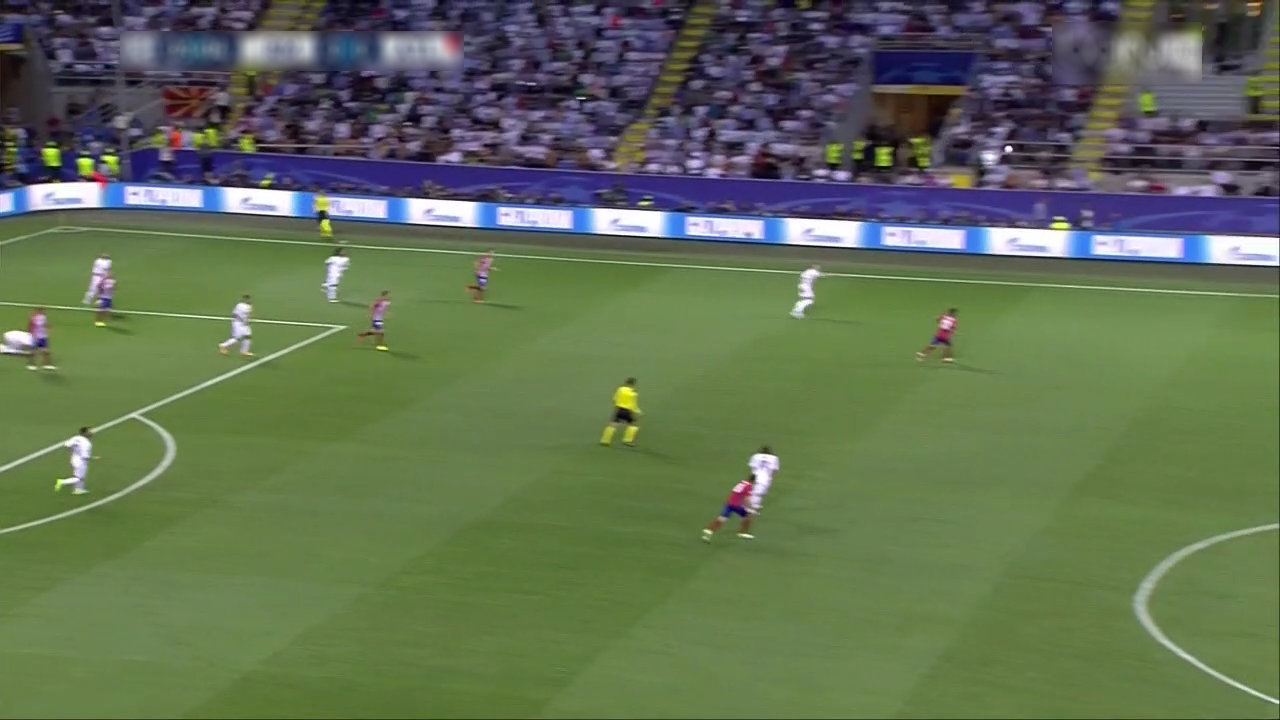
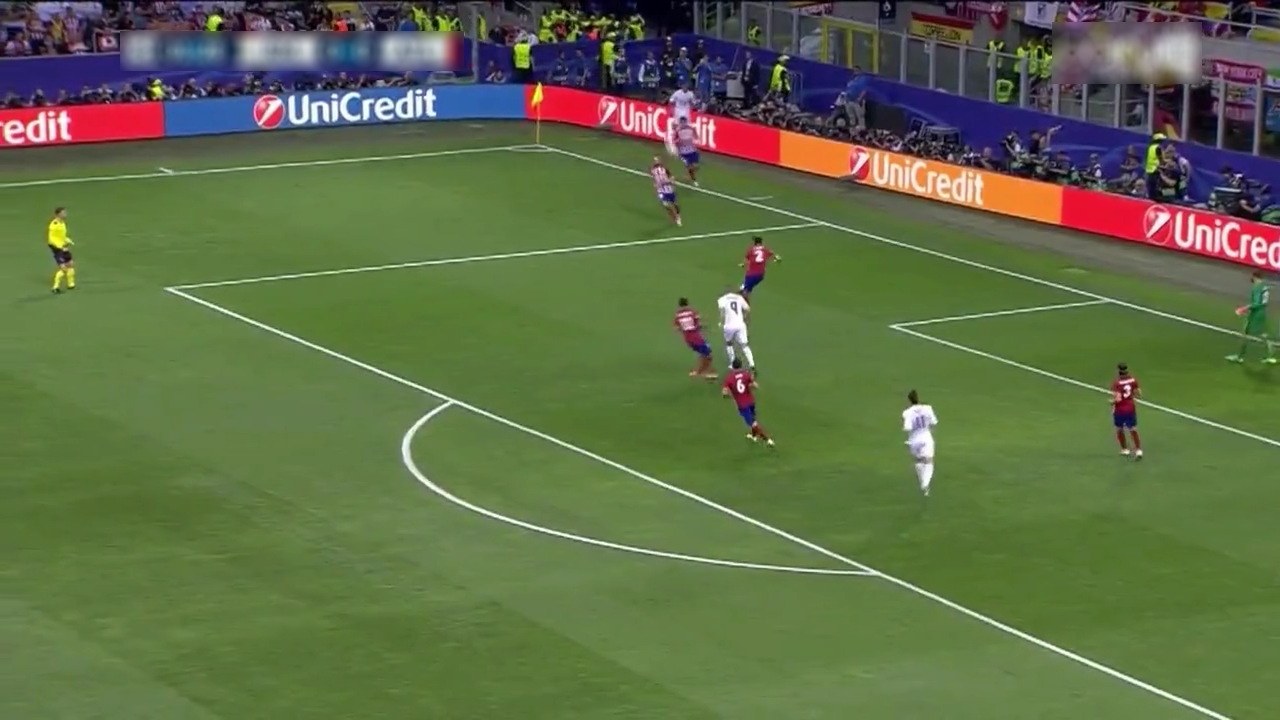
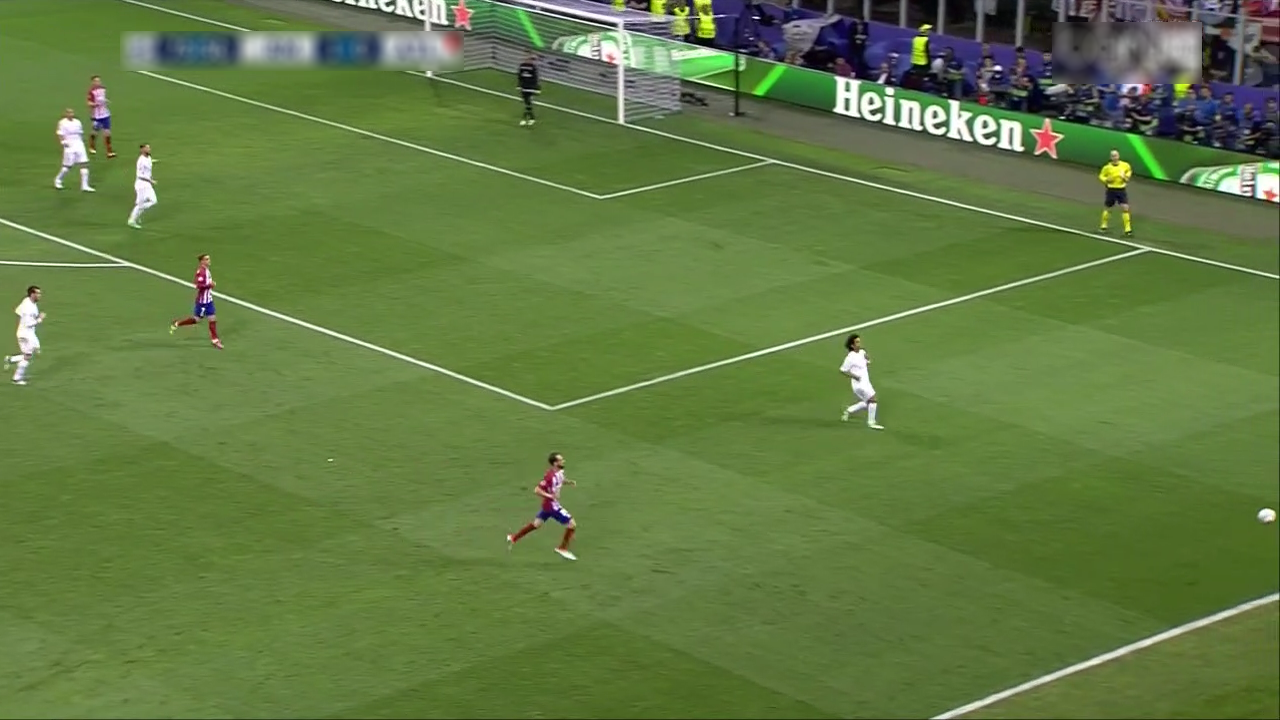
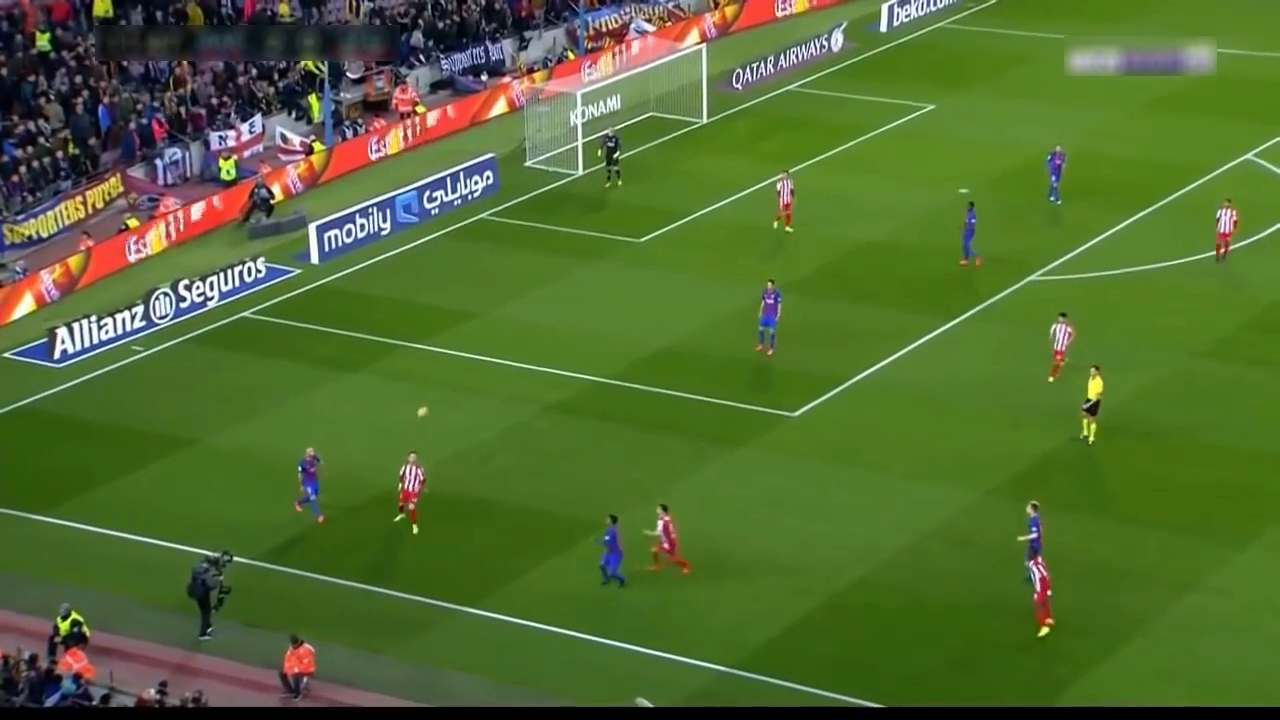
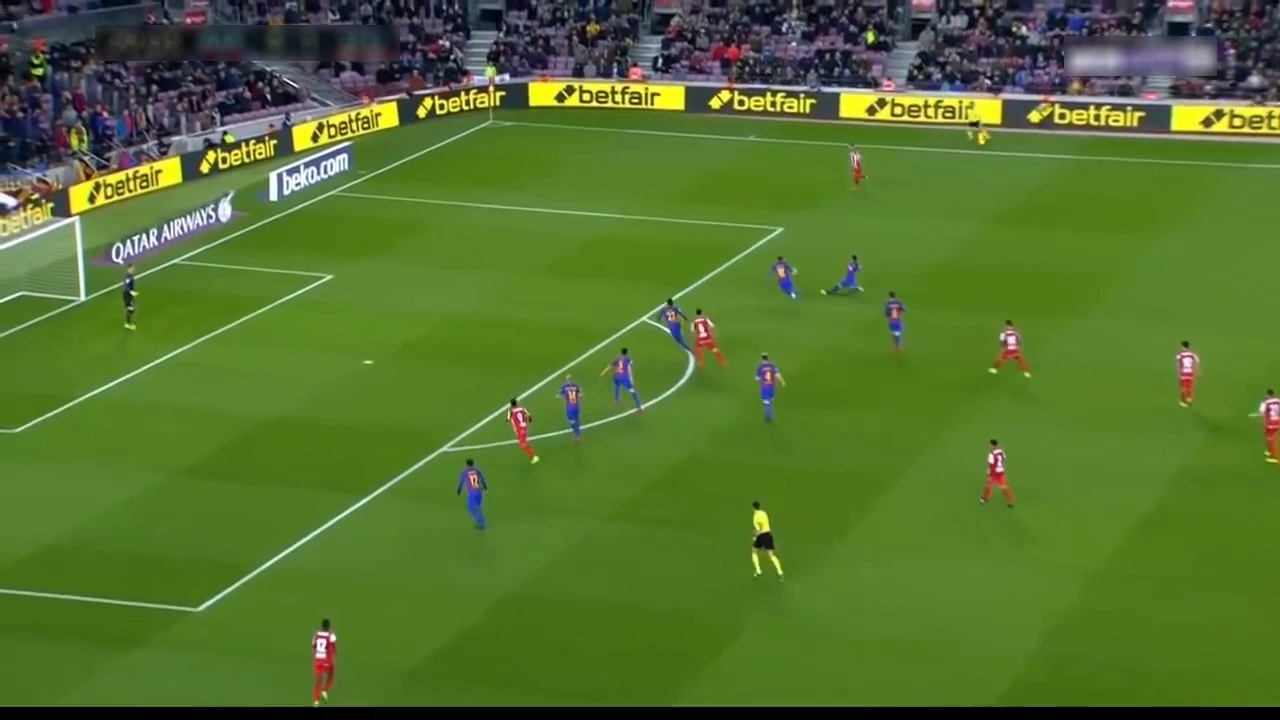
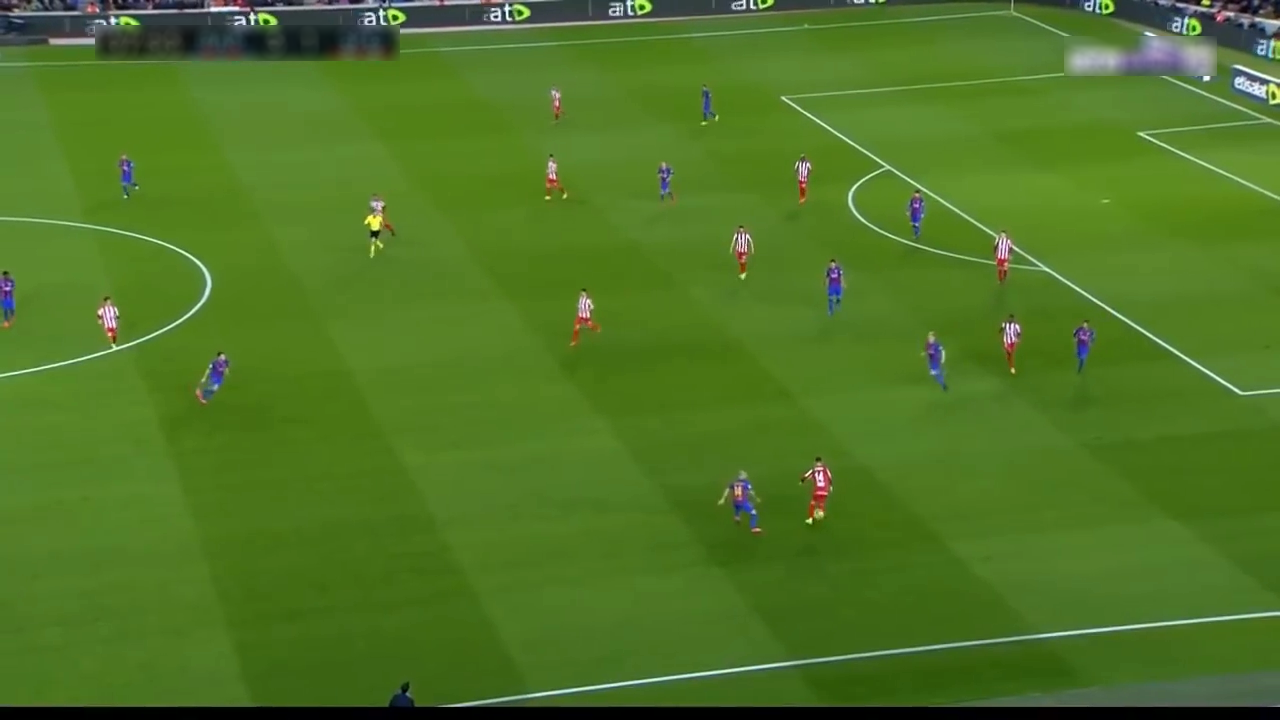
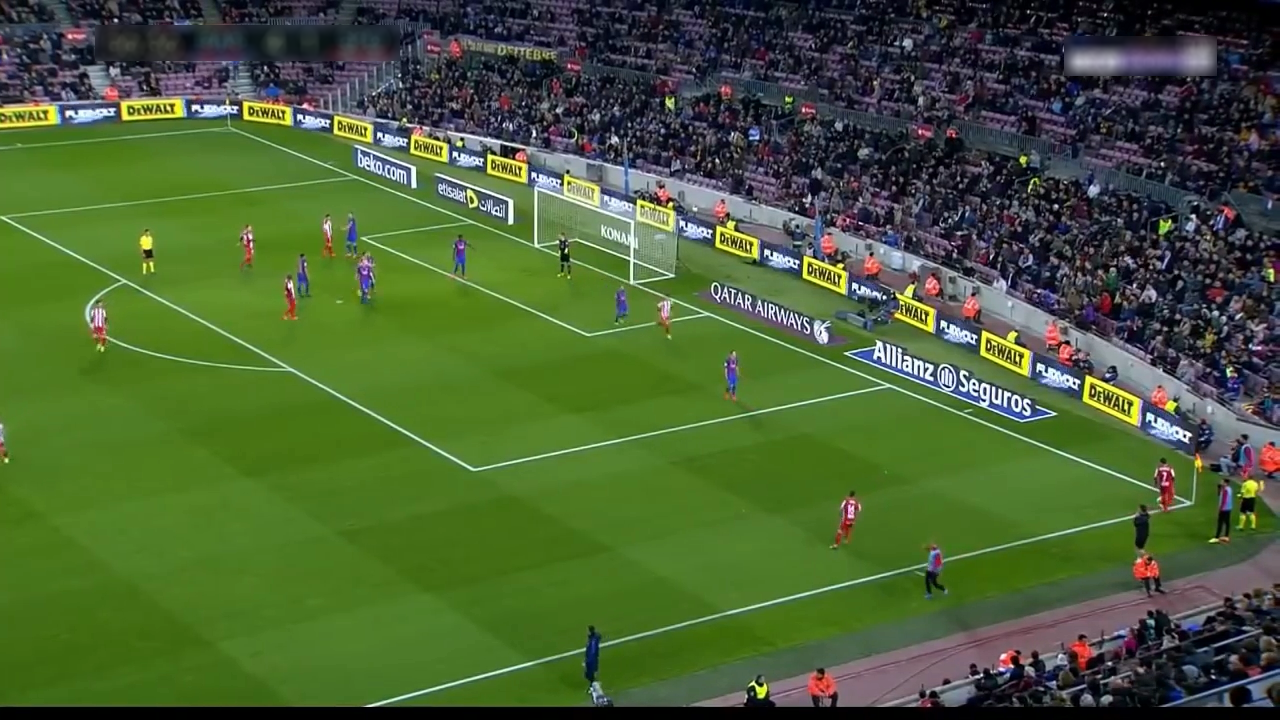
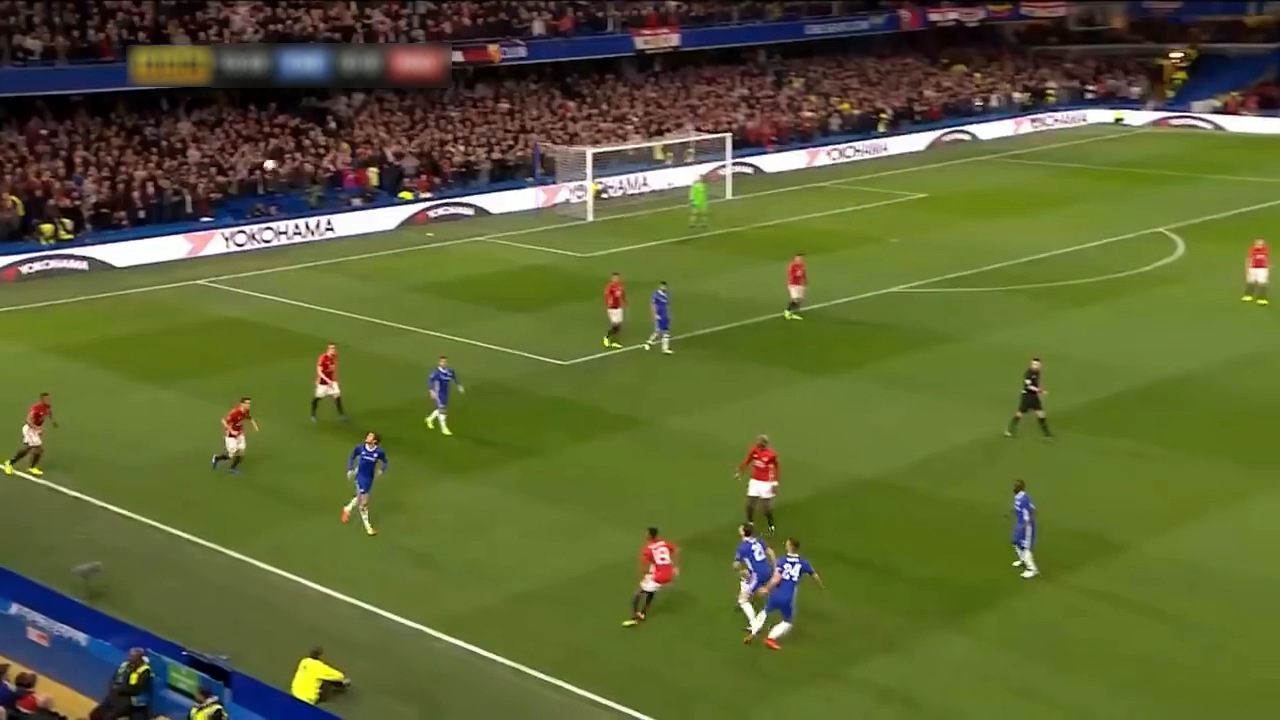
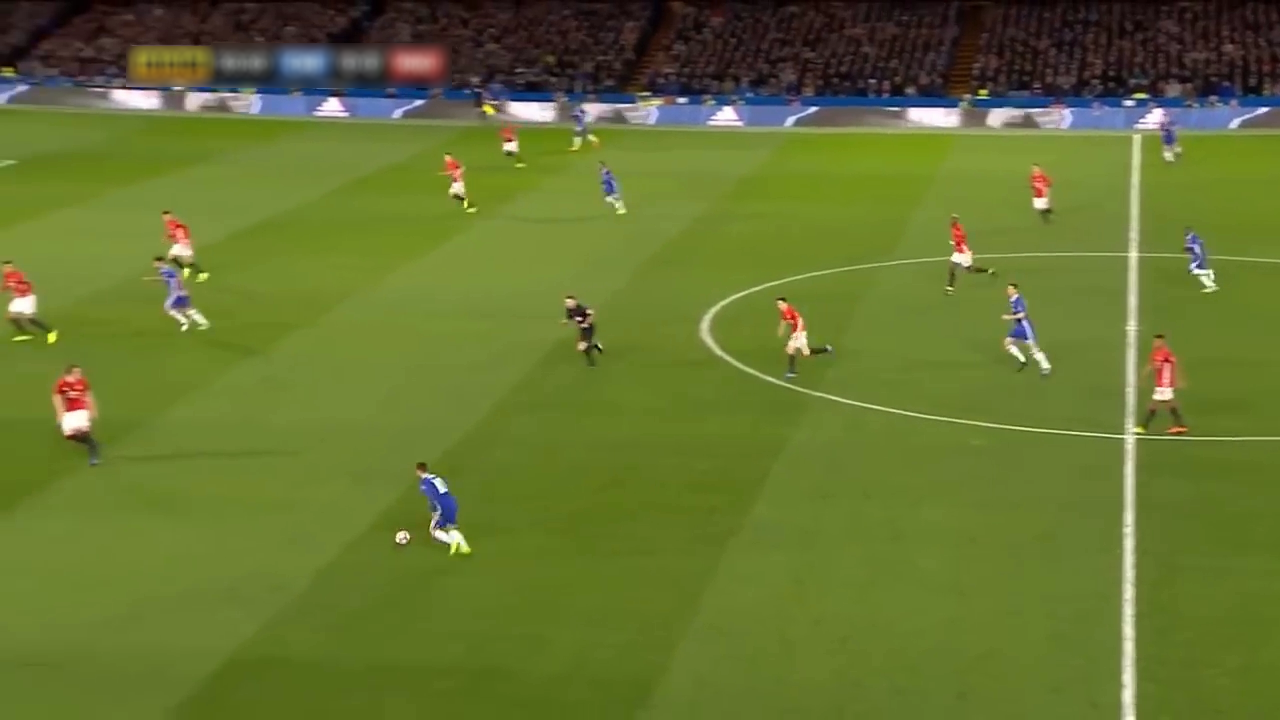
The following material corresponds to twelve sequences recorded in three different stadiums in European championship finals.
These stadiums have been chosen mainly because the different positions of the Master Camera (different heights and different distances to the field of play), but also because their different grass colors.
The main characteristicas of these sequences are the following:
Name |
Resolution | Master Camera distance | Cross ratio |
|---|---|---|---|
| Stadium 1 | 1280 x 720 |
28 meters |
3.63 |
| Stadium 2 | 1280 x 720 |
52 meters |
3.65 |
| Stadium 3 | 1280 x 720 |
19 meters |
3.10 |
For each stadium, four types of sequences have been considered, each of them corresponding to a different part of the field of play:
- Type 1: Lower-left area.
- Type 2: Upper-left area.
- Type 3: Upper-right area.
- Type 4: Lower-right area.
For each of the sequences the following material can be downloaded:
- Original images.
- Results:
- Field of play segmentation mask.
- Mask of line segments.
- Line mark classification.
- Playing field model proyected on the original images.
- Ellipse detection and modeling (if the central circle of the play of field appears in the image).
The model of the field of play and the set of images used to construct the tilt probability models can be downloaded from here.
Stadium 1:
Type 1
|
Type 2
|
Type 3
|
Type 4
|
Stadium 2:
Type 1
|
Type 2
|
Type 3
|
Type 4
|
Stadium 3:
Type 1
|
Type 2
|
Type 3
|
Type 4
|


Grupo de Tratamiento de Imágenes (GTI), E.T.S.Ing. Telecomunicación
Universidad Politécnica de Madrid (UPM)
Av. Complutense nº 30, "Ciudad Universitaria". 28040 - Madrid (Spain). Tel: +34 913367353. Fax: +34 913367353